Ensure that you have Java installed; at least version 1.8. Go get the Java Runtime Environment (JRE) from the Java site (https://www.java.com/en/download/) or from https://adoptopenjdk.net/
Once you have it installed, unzip the contents of the latest Data Excelerator zip file into a folder on your local machine. e.g. C:\DataExcelerator and open the zip file to extract the MSI. This will install the product in Windows.
When DE launches, a project is opened in NEW mode. You can save it right away, or wait till you actually have something in it. Most people will want to start right away by creating a diagram, probably for a data model.
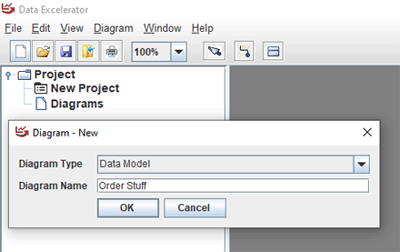
Click on the Diagram menu and choose New, or click on the New icon on the diagram group on the tool bar along the top. A dialog will launch where you have to give the diagram a name. After entering one, click on OK and the name will appear in the project tree and a diagram window will appear in the empty area on the right.
The system will auto-save the project details. So when you save a diagram, the project is changed automatically. Except the first time, when you have to create it with a file name.
Just click on the Diagram menu and choose Save. Or click on the save icon in the Diagram group. A Save dialog will appear and default to the Diagram name (sans spaces) with the suffix ded (Data Excelerator Diagram).
The Most Recently Used Items will be a list of projects.
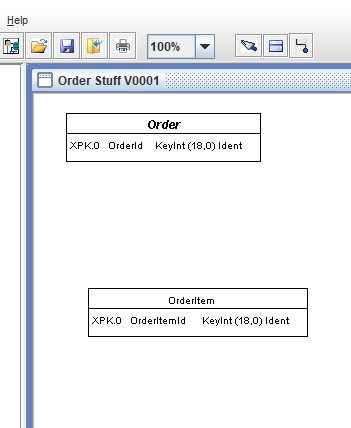
To add an entity to the Entity-Relationship (Data model) diagram, click on the Entity icon at the top of the toolbar. As your mouse hovers over the Diagram pane, you can click at any point to add an Entity at that point. The mouse will return to pointer state.
When an entity is created, a few things happen automatically.
Now add another Entity and rename it to "OrderItem".
To delete an entity, just click on the delete key on the keyboard or on the delete option in the hover over.
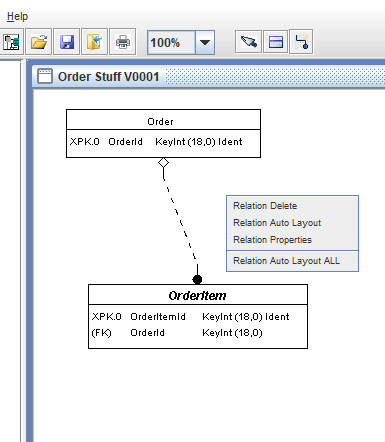
To add a relationship between two tables in the Entity-Relationship (Data model) diagram, click on the Relationship icon at the top of the toolbar. As your mouse hovers over the Diagram pane, it will change to the relation pointer.
Click on an entity to denote the "FROM" for a relationship. Click on a second entity to denote the "TO" for a relationship.
A line will be drawn from the parent to the child entity and the Logical Primary Key will be migrated from the parent table to the child table. (This feature can be turned off in the configuration screen.)
You can click on the same Entity twice to add a self join. This kind of relationship will default it's migrated field to the Key field name suffixed with a number.
The end points of a relationship can be moved to any face of an entity to allow the modeller to control where the lines are drawn.
The user can choose Diagonal or Orthogonal lines in the Diagram Properties screen.
The user can also choose Bachman (dots) or Martin (crow's feet) notations.
To delete a relationship, select the relationship when the cross pointer is hovering over a line. Then choose the delete option.
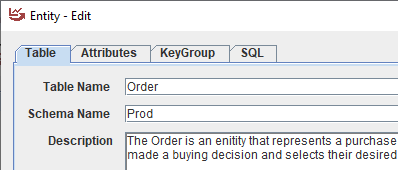
Choose an Entity by double clicking on it (or hover over and right click and choose properties). The Entity Edit dialog has several tabs.
The Table tab allows you to change the table name, enter a description for the data dictionary, and add a schema name (if you are going against Oracle.)
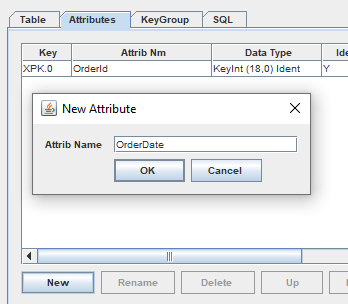
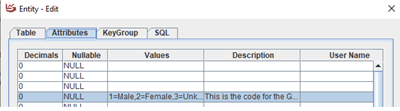
The Attributes Tab allows you to define the list of attributes for that entity.
To add, click on the new button. In the new dialog, enter a new field name (must be valid with only alphas, digits, or underscore or hyphen separators). The name must be unique on the table.
It gets added with a default string data type. This can be changed using the combo box next to the name to select from the diagram data types. Various other values will be defaulted when you choose a value. You can override the values once selected. e.g. length, decimals, or even the database datatype mapping.
You can rename an existing field by selecting that row and then the rename button. The rename dialog will ensure the same naming and uniqueness rules as before.
To delete a row, select it and then click on the delete button. There is no confirmation dialog unless configured.
To move a row up or down, select it and then click on up or down. There are no rules as to where the Logical Primary Key must reside.
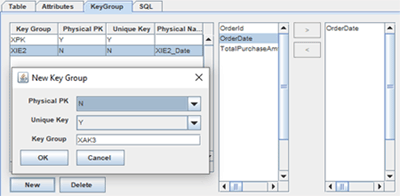
In the Entity Edit dialog, the The Key Group tab allows the user to define as many keys as they want for a table. One can be used as the Physical Primary key and others can be Alternate Logical Primary Keys. Still others can be non-unique search keys.
Click on the New button to create a new row in the list of Key groups. A defining dialog appears with the ability to choose the type of key. The key name will be defined by default based on the type of key selected. The user can override this name if desired. If the user wishes to customize the physical name of the index for back end generation, then they can enter that value in the grid.
Once the key is defined and selected, then the field(s) from the table can be added to the index definition using the Left or Right Arrow buttons as appropriate.
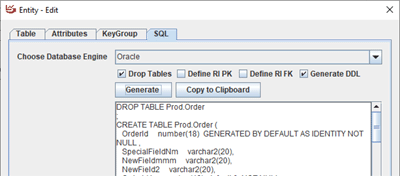
In the Entity Edit dialog, the SQL tab allows the user to generate the SQL for the desired back-end. The resultant DDL is displayed in the text window. It can be copied to the clipboard for easy use in other tools.
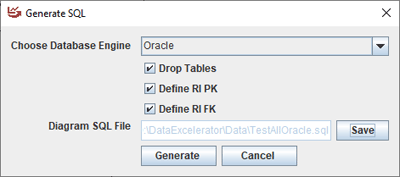
Another option is to generate the DDL for all the tables in the diagram. From the Diagram menu, choose the "Generate DDL" option which will display the corresponding Dialog. The user can choose a file output name in a standard dialog. The user can choose a backend and the program will generate all DDL for all tables into the selected file.
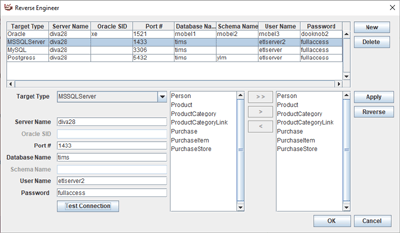
Once an empty (or not) diagram exists in the pane, then an existing database's tables can be reverse engineered into it. You can choose this function by clicking on the Diagram menu followed by the Reverse Engineer option to display the dialog.
The first step in reverse engineering a database into a data model is to define the connection string. Enter the Server name / IP, the database (schema) name, user name and password. Note that the password is displayed in clear text. When a connection string is stored in the diagram, it is encrypted.
Click on the Test Connection button to reach the server. When successful, a message will appear and the tables in that schema will be listed. You can decide to reverse all or just some of the tables presented. Click on Apply to save the connection string and the selected tables as part of the diagram.
If re-entering this screen, the connection will have to be re-tested before reversal is allowed.
Click on the reverse button and the selected tables will be reversed from the target database into Entities and relations in the diagram. The data type mapping is internal to the program and currently cannot be customized.
The relations are inferred from the naming convention. If Primary and Foreign keys are present, they are also used to infer relationships between tables.
Once a data model is developed against and the code and the database is deployed to some production environment, then it needs to be recorded as a labelled version.
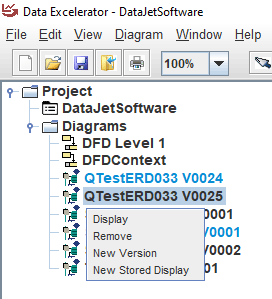
To do this, simply right click on the diagram in the tree and choose the “New Version” option. This will copy the diagram file to a new file with the existing version number as a suffix. The new diagram file will be saved with a locked flag turned on to prevent updates.
The original file will have its version number incremented and can now be checked back in to github (or wherever) to document the state of the data model at that point in time.
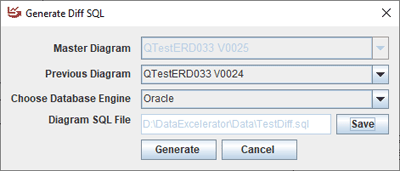
Another function that versioning provides is the calculation of changes to the DDL. The user chooses the newest diagram and then chooses the Diagram, Generate Diff DDL option. The system displays a dialog which allows you to choose the previous diagram to compare with. (It will default to the previous version.) Choose the back end and only the changes will be generated into DDL (drop /add table, columns, rename, etc.)
The model should be the master and have the ability to generate a Data Dictionary in a way that can be easily consumed by the business; such as an excel spreadsheet.
The table description is added in the first tab of the Entity Edit dialog.
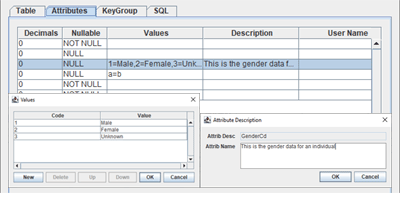
Field level description is done from the Attributes tab by sliding the grid to the right and then clicking on the description column. The system will launch the Attribute Description dialog. In this dialog, you can add whatever description of the attribute that is desired.
Field Level Values is done in a similar way by clicking on the Values column, which launches the Value Editor. Documenting values for a coded field is very useful for the business to evaluate correctness and for the programmer to provide help in ensuring correct values are accepted and/or displayed.
User field name is an entry where the label the end-user gives to describe the concept can be documented.
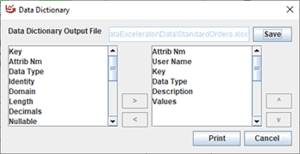
When the data has been loaded in the model, it can be exported into excel. Use the Diagram menu with the Data Dictionary option. A dialog will appear and ask for the file location. On OK, the system will create an excel file with a tab per database table with relevant fields including description and values.
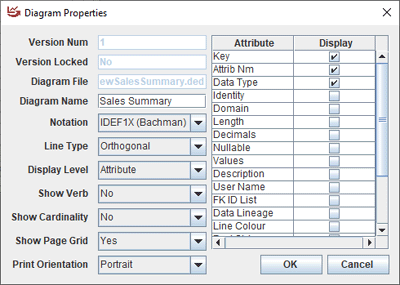
To configure some of the diagram's behaviours, you can edit them using the Diagram - Properties menu option. This will launch a configuration dialog where different parameter settings will have different effects.
Display level can be Attribute (default), or Entity (for context level diagrams)
The notation can be changed from Bachman (dots) to Martin (crows feet)
The line type can be changed from Diagonal to Orthogonal.
Show Verb and Cardinality are not effective at this time.
Show Page grid displays the light gray boundary of where printed page boundaries exist.
Print orientation can be changed from Portrait to Landscape. The page grid will reflect the different setting.
These changes will take effect once the OK button is clicked.
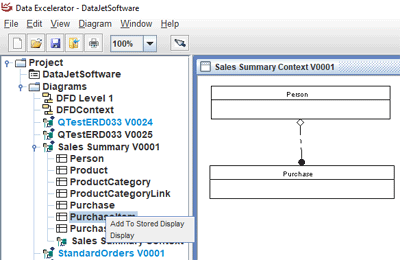
To create a child diagram of the primary data model, once you have opened a diagram, right click on the tree for the "Add Stored Display" option, or choose the "Stored Display" option from the Diagram menu.
A diagram is created as a child of the original parent. You will have to remember to save the original parent diagram, which is why you can't create a stored display for a version locked diagram. It is a full diagram with some functions disabled.
You can change the display parameters to show only the Entity level and hence have a "Context" level diagram.
You can add whatever tables you want to the Stored Display by right clicking on a table and choosing the "add to stored display" option. This puts a copy of the table on the diagram. You can move that table around to a different place and it will remain there even if you move the table in the parent diagram.
You can generate DDL for the subset of tables in your Stored Display diagram.
To create a Data Flow Diagram, click on the Diagram menu and choose New, or click on the New icon on the diagram group on the tool bar along the top. A dialog will launch where you have to give the diagram a name. Choose the Data Flow Diagram option from the combo box and click on OK.
The name will appear in the project tree and a diagram window will appear in the empty area on the right. The icons in the tool bar at the top will change to show the objects that can appear on the diagram. As each object is dropped on the diagram, the appropriate edit box is displayed.
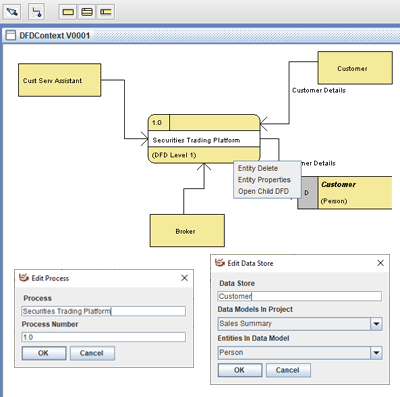
Each diagram should at least have one process object. This defines the flow that is being discussed. Next the participants who will interact with the system are added under the label "external entities". If data is created or referenced, then the Data Store object can be used to show a data "sink".
To optionally link a Data Store to an ERD, choose the Data Model from the combo box which lists the ERDs in the project. On choosing an ERD, the entities (tables) are displayed in the next combo box. If a choice is made, then the table is displayed on the DFD in brackets.
To drill down into a DFD, right click on the process box and choose the bottom entry to "Create Child DFD". This action will create a new diagram, store it, and link it to the parent diagram. To edit this diagram, right-click again and it will show the option "Open Child DFD". The child diagram can be shown by launching it from the project tree as well.
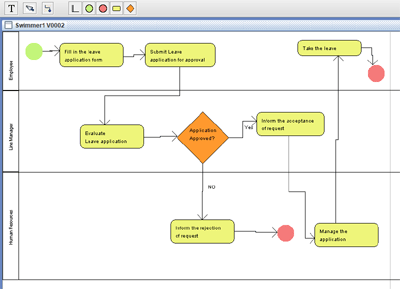
To create a Process Flow Diagram, click on the Diagram menu and choose New, or click on the New icon on the diagram group on the tool bar along the top. A dialog will launch where you have to give the diagram a name. Choose the Swim Lane Diagram option from the combo box and click on OK.
The name will appear in the project tree and a diagram window will appear in the empty area on the right. The icons in the tool bar at the top will change to show the objects that can appear on the diagram. As each object is dropped on the diagram, the appropriate edit box is displayed.
Each diagram should at least have one swim lane object. This defines the flow that is being discussed. It will snap to the left. It can be labelled, resized, and changed order.
Next the system will have start/stop markers put into place. Then add decisions and who makes them. As each new player becomes part of the discussion, add them in a swim lane and draw them into the process.